Here we learn about how to create GIS data from primary sources: taking measurements in the field and digitizing aerial photographs.
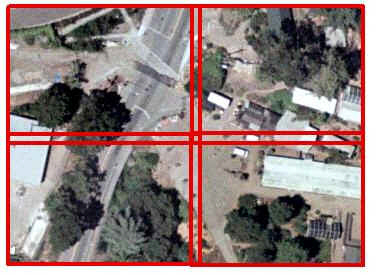
The first step was to visit the Botanical Garden with an aerial photograph of the northeast quadrant. It helped to bring along a printout of the photographs of all four quadrants, since together they show more landmarks, especially the zebra striped crosswalk on Centennial Drive and the large glass greenhouse. Relative to these landmarks, I was eventually able to identify the entrance kiosk and garden shop on the photograph, and from there identified the nearby buildings.
The main obstacle was that most of the area in the photograph wasn't open to the public. I had to try to get as close as possible, look through the fence, and estimate the locations and sizes of buildings and trees. The height, crown size, and diameter at breast height of the trees were estimated very crudely by comparing them to nearby objects that I could measure with a tape measure; my uncertainty in these measurements was around 20 percent.
I had to make some choices about what to record. I decided that transformers and dumpsters are not "buildings" and didn't record them although they are visible in the photograph. Some shrubs and trees didn't have labels or were too far away to see clearly, so I couldn't record their exact species.
iMap is a utility developed at Berkeley for digitizing maps for the East Bay Hills fire study. I installed it on my computer, downloaded the photograph, and began tracing the buildings and vegetation. The buildings should be mostly rectangles, but I don't see any way to constrain the sketch tool to only draw right angles; probably the more full-featured editing tools in ArcMap could do that.
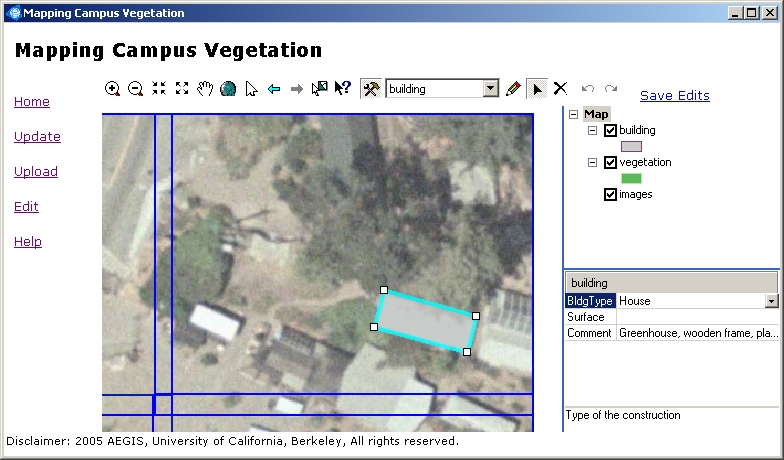
The pre-set fields of the attribute tables required some interpretation. Greenhouses and offices were entered as "house" and the paved areas (including Centennial Drive and parking places) were entered as "driveway". I wondered whether to record a trellis, and decided to enter it as "garage" since it's a structure but not an enclosure. I also decided that the "surface" field applied only to paved areas, not to structures, so for structures I left "surface" empty and entered notes on building materials under "comments". In the vegetation layer, Crown, DBH, and Ladder apply only to trees (note: DBH was entered in inches rather than cm, since that's how I had written it down). Height applies to trees and brush. Some areas of ground-covering plants, as well as potted plant areas, were entered as "grass", with notes on the particular composition under "comments".
All of this could also have been done in ArcMap with the Editor toolbar, but we would have had to create the attribute tables from scratch and define all their fields.
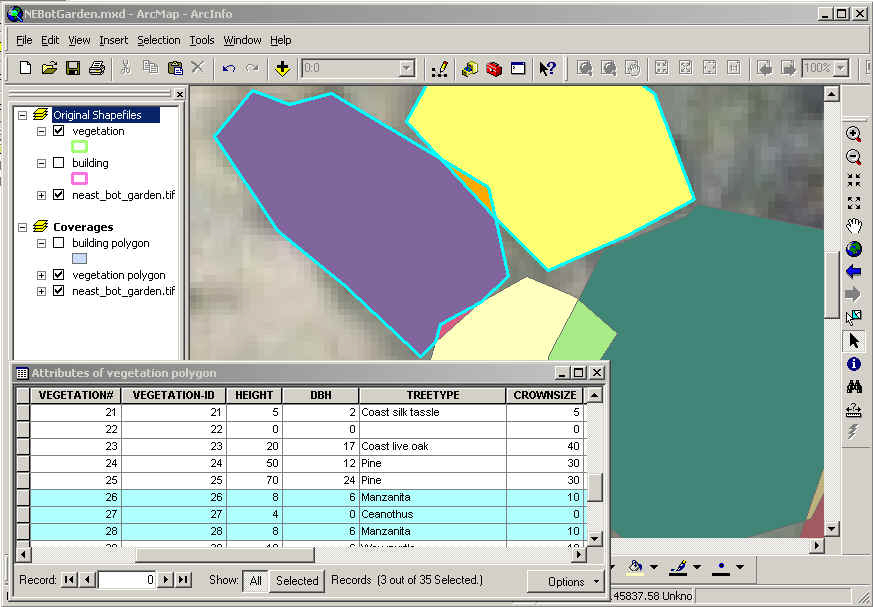
I copied the entire "data" folder created by iMap into my own directory, started ArcMap, and loaded these layers:
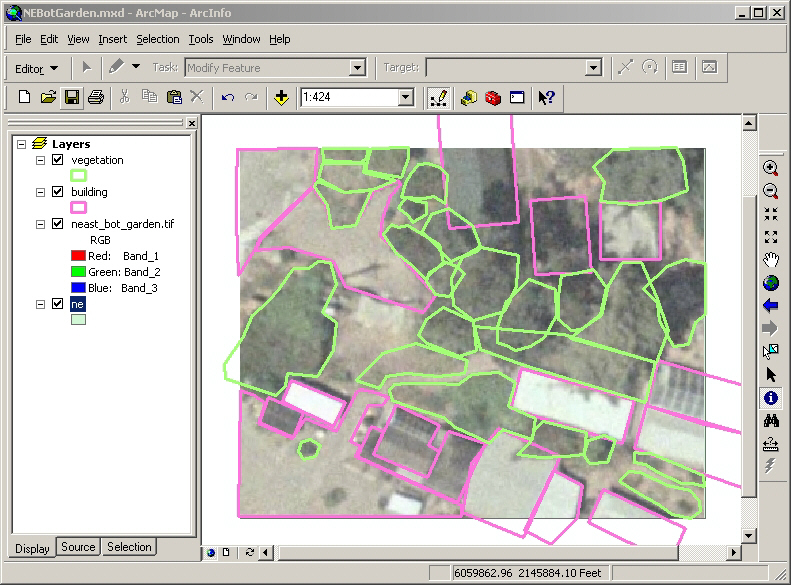
Unfortunately, iMap recorded the drop-down menu fields as numbers. To show these fields properly in ArcMap, I created new tables to translate the numbers into names (this might have been easier with Excel, but I wanted to see whether ArcMap could do it by itself):
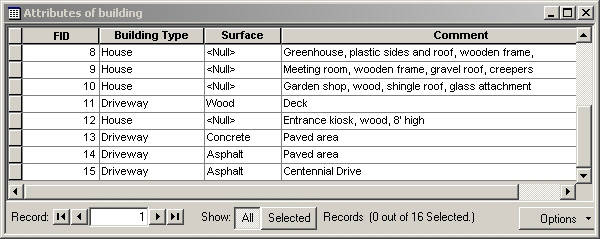
Finally, I joined the translation tables to the attribute tables, and also selected which fields to display using the Fields tab of the Layer Properties dialog box. Here are parts of the resulting attribute tables (recall that Height and Crown Size are in feet, while DBH is in inches):

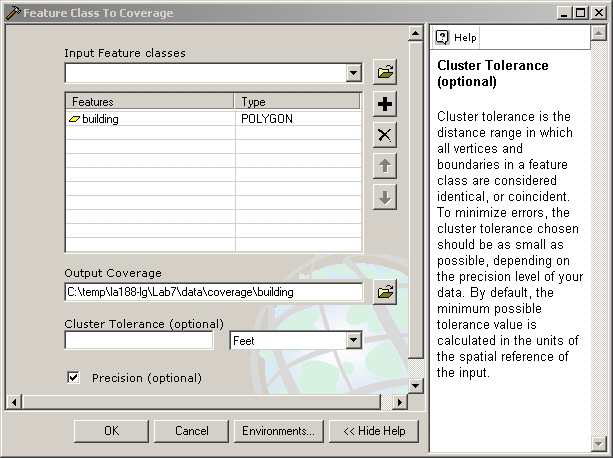
A "coverage" is a format used by previous versions of ArcInfo for vector data including attribute layers and topology. As of the ArcGIS 9 releases, ESRI wants to supersede it with the "personal geodatabase" format, but since there's a lot of data out there in coverage format, we need to be familiar with converting back and forth. The conversion is found in ArcToolbox > Conversion Tools > To Coverage > Feature Class to Coverage; here's the dialog box telling it that the input shapefile consists of polygons, and to use a default value of cluster tolerance.
This usually resulted in a complaint of "Invalid Topology":
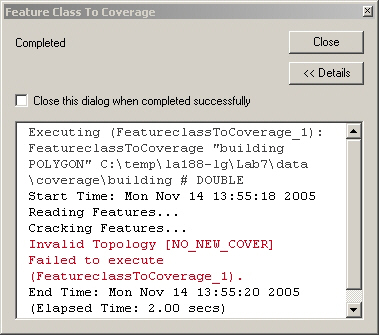
but not always; it wasn't reproducible even with the same input data on the same computer. I tried exporting the data layers, using a trial data layer with no overlapping polygons in it, and changing various parameters in the dialog box, but it didn't make any difference. Finally I realized that the message doesn't matter, since the coverage is created anyway.
So what has been done in making a coverage from the building
shapefile?
building, containing
binary files of spatial information, and info, containing
attribute tables. See help under Geoprocessing > Coverage toolbox >
How coverages are stored.arc.adf);
centroids of the polygons (cnt.adf); and a list of which arcs
make up each polygon (pal.adf). There could also be lists of
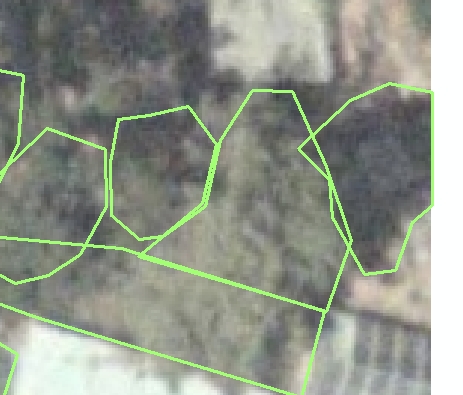
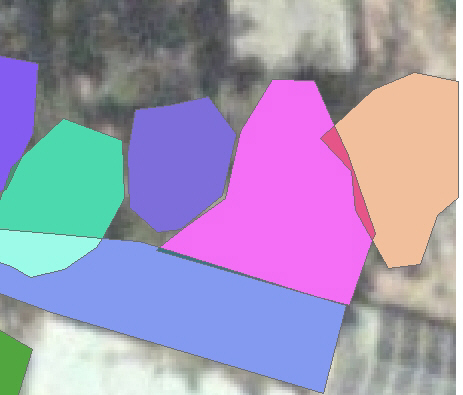
label points, tics (i.e., geo-referenced points), and boundaries.| Overlapping polygons in original shapefile: | After converting to coverage, each intersection area becomes a new polygon: |
 |
 |
The Clean tool (Coverage tools > Data Management > Topology > Clean)
does steps #3 and 4 above, if they haven't been done already. It can also merge
points within a fuzzy tolerance, and remove dangling arcs, if requested; this
could be useful for getting rid of the sliver polygons. Since I didn't request
these options, the polygons in the cleaned coverage are the same as before.
However, according to the help screens for the Clean tool, "Label points
are required if you want non-zero polygon User-IDs and if you want to maintain
polygon attributes." Since we didn't have any label points, the contents of
the attribute table are wiped out (the fields are still there, but they're all
zero or blank):
![]()
To retrieve the attributes, or keep from losing them in the first place, we could create labels with the Create Label tool, as described in the lab instructions.
My shapefiles, building.* and vegetation.*, are
uploaded to my home directory on mahagonny, la188-lg.