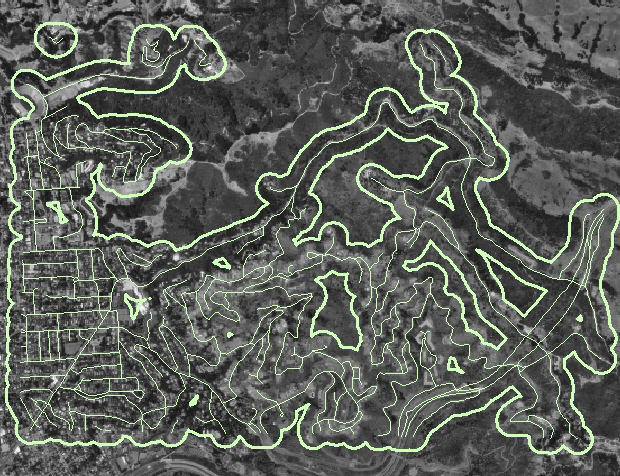
I would like to live close to shopping, public transportation and other services. For example, if we had a database of point features like schools, fire stations, or BART stations, we could look at locations near them. In lieu of more detailed information, I'll assume that any location near an existing road has sufficient access to services. I don't want to have to build more roads; it would just mean more time driving back and forth, and would degrade the open spaces and parks.
After comparing the roads layer to the USGS quadrangle map and the digital
orthophoto, I realized that it includes fire trails, which should not be counted
as part of the developed area. The type of road is described by the MINOR1
field; the metadata doesn't fully explain the codes, but it gives a link to the USGS
documentation. So, first I selected only the improved roads (MINOR1 = 0201
through 0209), and exported them as a layer. Then I used the buffer tool to create a buffer of 300 feet around them;
this distance was chosen by trial and error to cover almost all of the
urbanized area without covering too much of the open space.

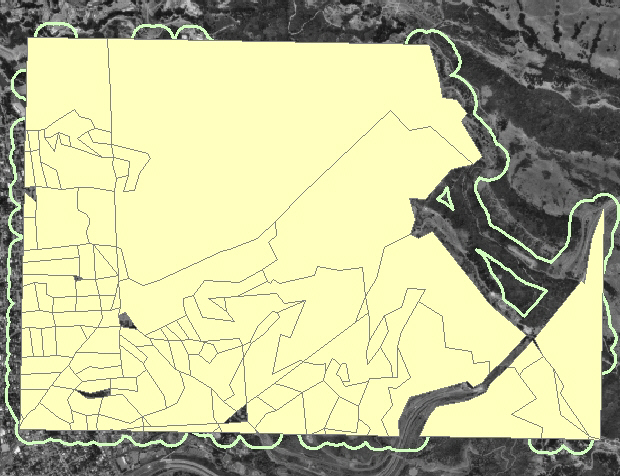
I would prefer infill development in the city, preserving the parks for recreation. Since we don't have data on the boundaries of the parks, I'll just assume that if any census block has zero inhabitants, there's a good reason, and consider only blocks that are already inhabited. This method isn't perfect, since some blocks are partly in the park and partly outside. Also, some of the empty blocks are Highway 24, but I don't want to live in that, either.
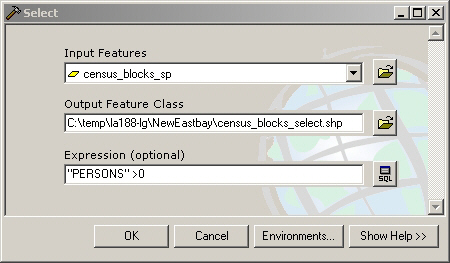
Trying out various tools in the Analysis toolbox, I used Extract > Select
to create a layer from the census blocks containing only the blocks with greater
than zero population.
The resulting layer, above the roads buffer area:
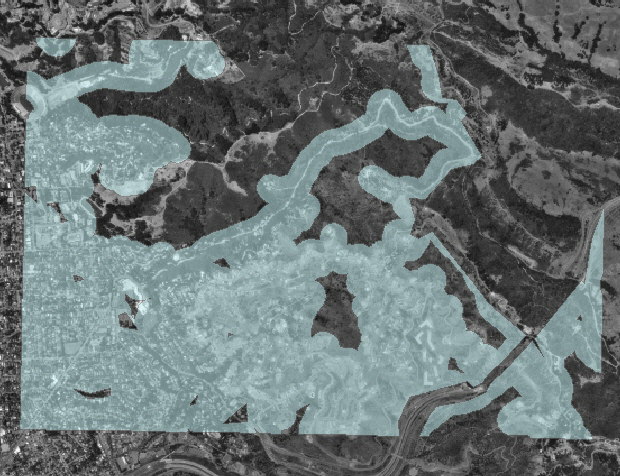
Then I used Extract > Clip to clip my roads buffer area to the inhabited
area.
The most important constraints here are natural disasters: earthquake, landslides, floods, fire. Also, there are steep slopes, which are difficult to build on. Combining every constraint would require expert judgment of the builder: is a site with good soil but a steep slope better than a site with worse soil but a gentler slope? Therefore, I'll focus on just two constraints, earthquakes and mudslides.
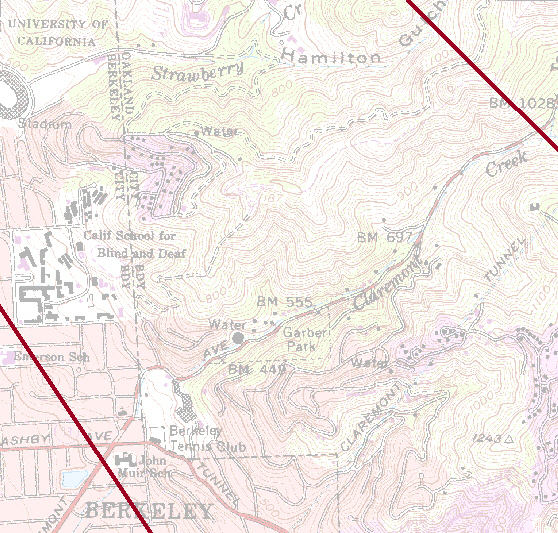
| (1) We all know that the Hayward Fault runs directly under the
football stadium, but the line on the map misses the stadium. |
 |
| (2) The lines are unrealistically straight; perhaps they
came from a much smaller scale map? An appropriate scale map, such as this
map of faults near campus from the university's Long
Range Development Plan EIR, shows much more complex faults. |
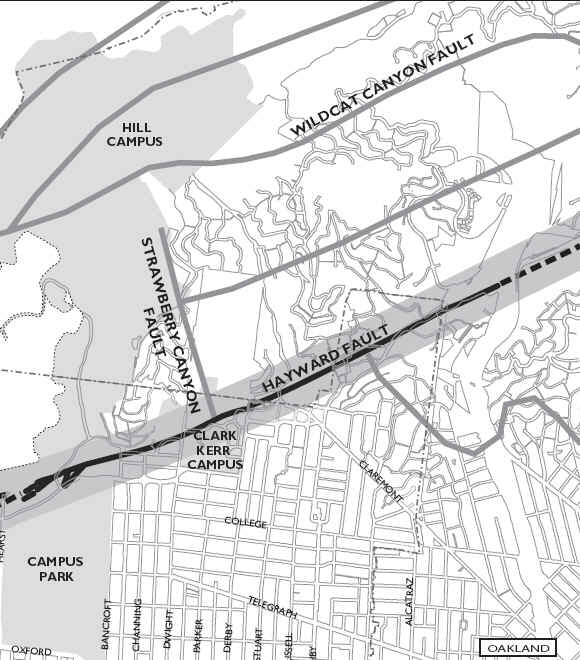 |
| (3) The faults are not equally hazardous; we all know the Hayward Fault (western line) is likely to be active, but the eastern line may represent the Wildcat Fault, which is not thought to be active, according to the EIR cited above. |
In reality an engineer would use a more detailed seismic hazard map, which shows areas of liquefaction and landslide hazards. Builders would want to avoid the Alquist-Priolo Earthquake Fault Zones, where construction is strictly regulated. These zones are typically 1/4 mile wide (the dark gray strip around the Hayward Fault in the EIR map above). But these data layers aren't available free on the web; they must be purchased. So for the purposes of this lab, I'll just use our faults layer, and create a buffer of 1/8 mile (660 feet) around the Hayward Fault.
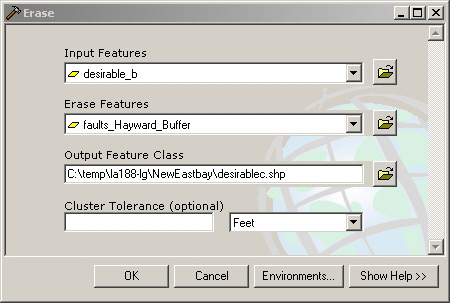
I selected the Hayward Fault; exported the selection as a layer; and used the buffer tool to create a buffer of 660
feet around it. Then I used the Erase tool to erase this buffer zone from
the desirable area.
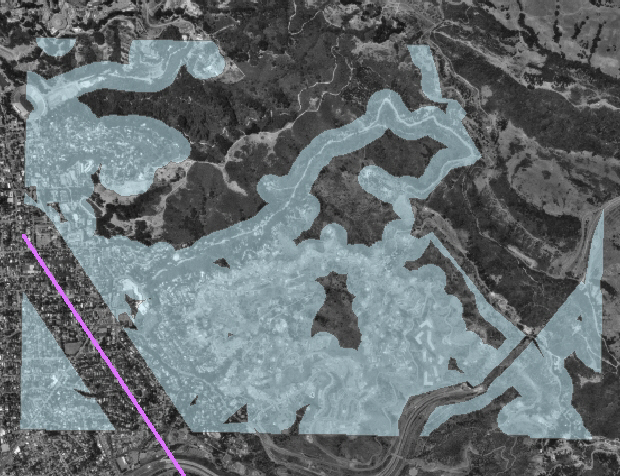
Here's the remaining area, showing the Hayward Fault as a purple line:
Poorly drained soils have a risk of mudslides during the rainy season. Higher permeability is better.
In order to select on values of population density and soil
permeability, I intersected my area with the soils layer. Here's the result,
symbolized by the PERM_HI field:

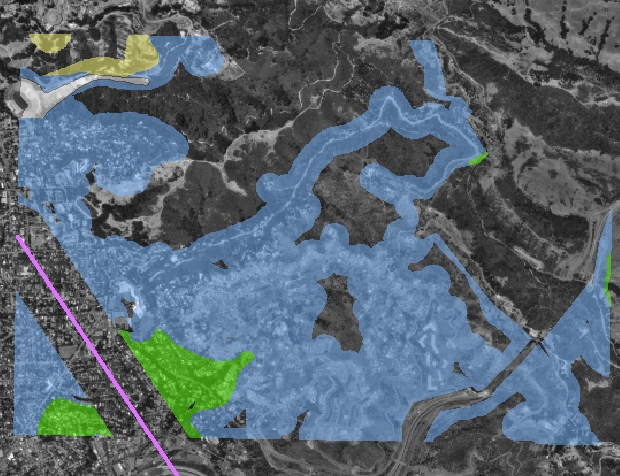
The blue areas are better for building.
We don't have a layer for the most important constraint of all, the landowners! Are they willing to sell? I'll just pretend I can afford whatever land I choose. Some of the blue area in the upper left corner contains part of LBL and the botanical garden, so that's out of the question.
Back in Lab 3, we were asking similar questions about different layers of data, but piling up symbology for different layers tends to make the maps hard to read. The tools in this lab produce much clearer maps, since it's possible to get rid of distracting polygons, keep only the relevant ones, and combine them all into a single layer.
However, when there are several different constraints, such as the fire and flood hazards that I didn't include, the problem is just inherently complex. Some people might want to rank different areas by defining a desirability function, calculated from criteria such as slope, predicted rate of spread of fire, soil permeability, geologic slope stability, etc.
As usual, the difficult part of this lab was trying to understand the faults and soils information and decide what to do with it. Once I decided what questions to ask, the ArcToolbox commands were easy. The only problem I had was that at first the buffer layer had the wrong coordinate system; it turned out I had mistakenly set the output coordinate system in the Tools > Options dialog under Geoprocessing, and it just had to be set back to same as input.